Example Work
My Work
Here is one of the projects I’ve done.
Project: Analyzing CTD Data
Data Description
This data is coming from an internship over the summer of 2025. The MGL2506 research cruise. The data could not be included as the file is too large it is on my hard drive and is private data so it will not beincluded only the visualizations will be. This data is from CTD drops. It includes parameters such as conductivity, temperature, depth, and dissolved oxygen. Some additional parameters were included from testing on the boat such as particulate organic carbon, nutrients, particulate organic phosphorus, insitu chlorophyll, flow cytometry, and DNA analysis. All of this data is compiled into a large excel sheet. Which is what I cleaned and filtered down to the parameters that I wanted. I then made serveral visualizations of the data.
Visualization 1
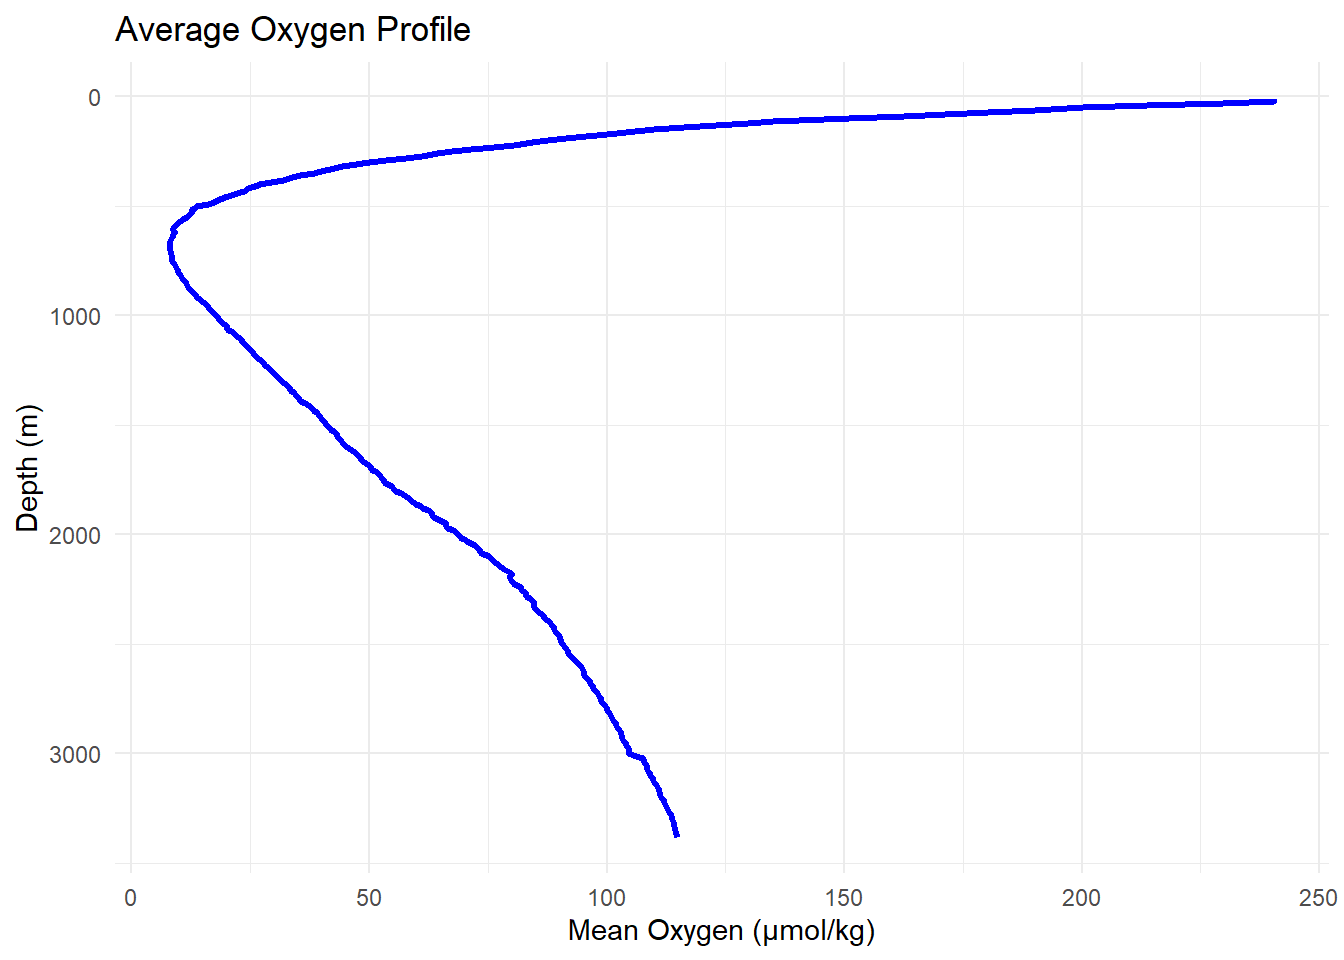
Figure 1 Vertical profile of mean dissolved oxygen (µmol/kg) as a function of depth (m). Oxygen concentrations are highest near the surface, decrease to a minimum at intermediate depths (~500–1000 m), and then gradually increase again in deeper waters, reflecting typical oceanic oxygen distribution patterns driven by biological activity and water mass circulation.
Visualization 2
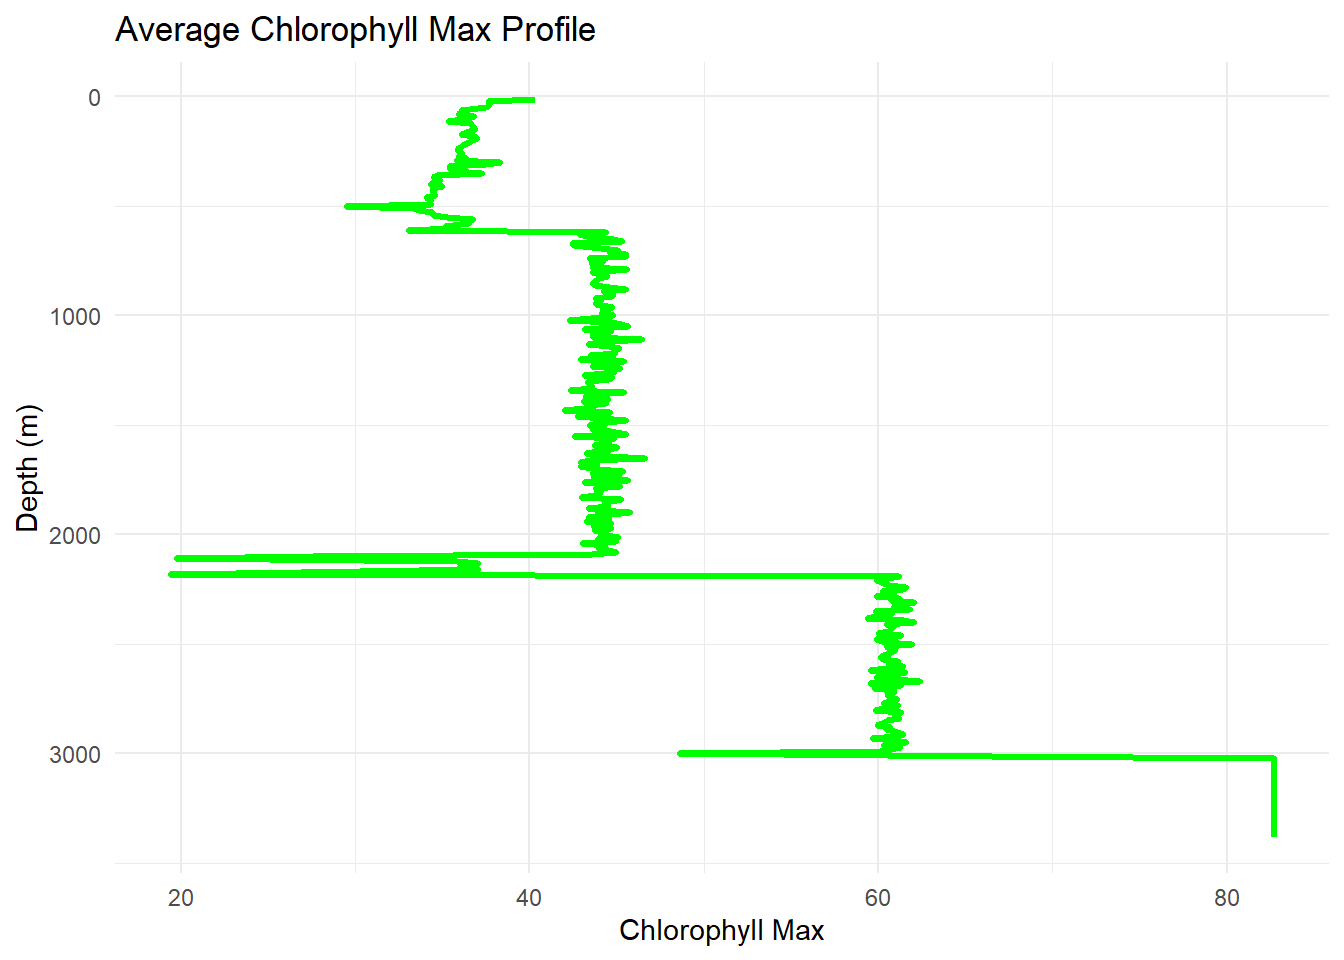
Figure 2 Vertical profile of maximum chlorophyll concentration as a function of depth (m). Chlorophyll values are highest in the upper ocean, indicating increased phytoplankton biomass in the euphotic zone, and generally decrease with depth as light availability diminishes. Variability at deeper depths likely reflects data noise or localized signals rather than sustained biological production.